Client Dashboard
The Client Dashboard shows up-to-date statistics about all client projects that you have permission to access. Client Administrators can view this dashboard.
The dashboard includes client-level storage metrics, project-level storage usage, project access information, and premium feature usage. Storage metrics include both current and peak values for the selected billing period.
The hosting size includes the total processed hosted bytes in SQL Database and Elasticsearch, as well as document files in active and archived projects. It includes both loaded and concealed documents. Peak hosted storage values for deleted projects remain visible during the billing period.
The following figure shows an example of the Client Dashboard.
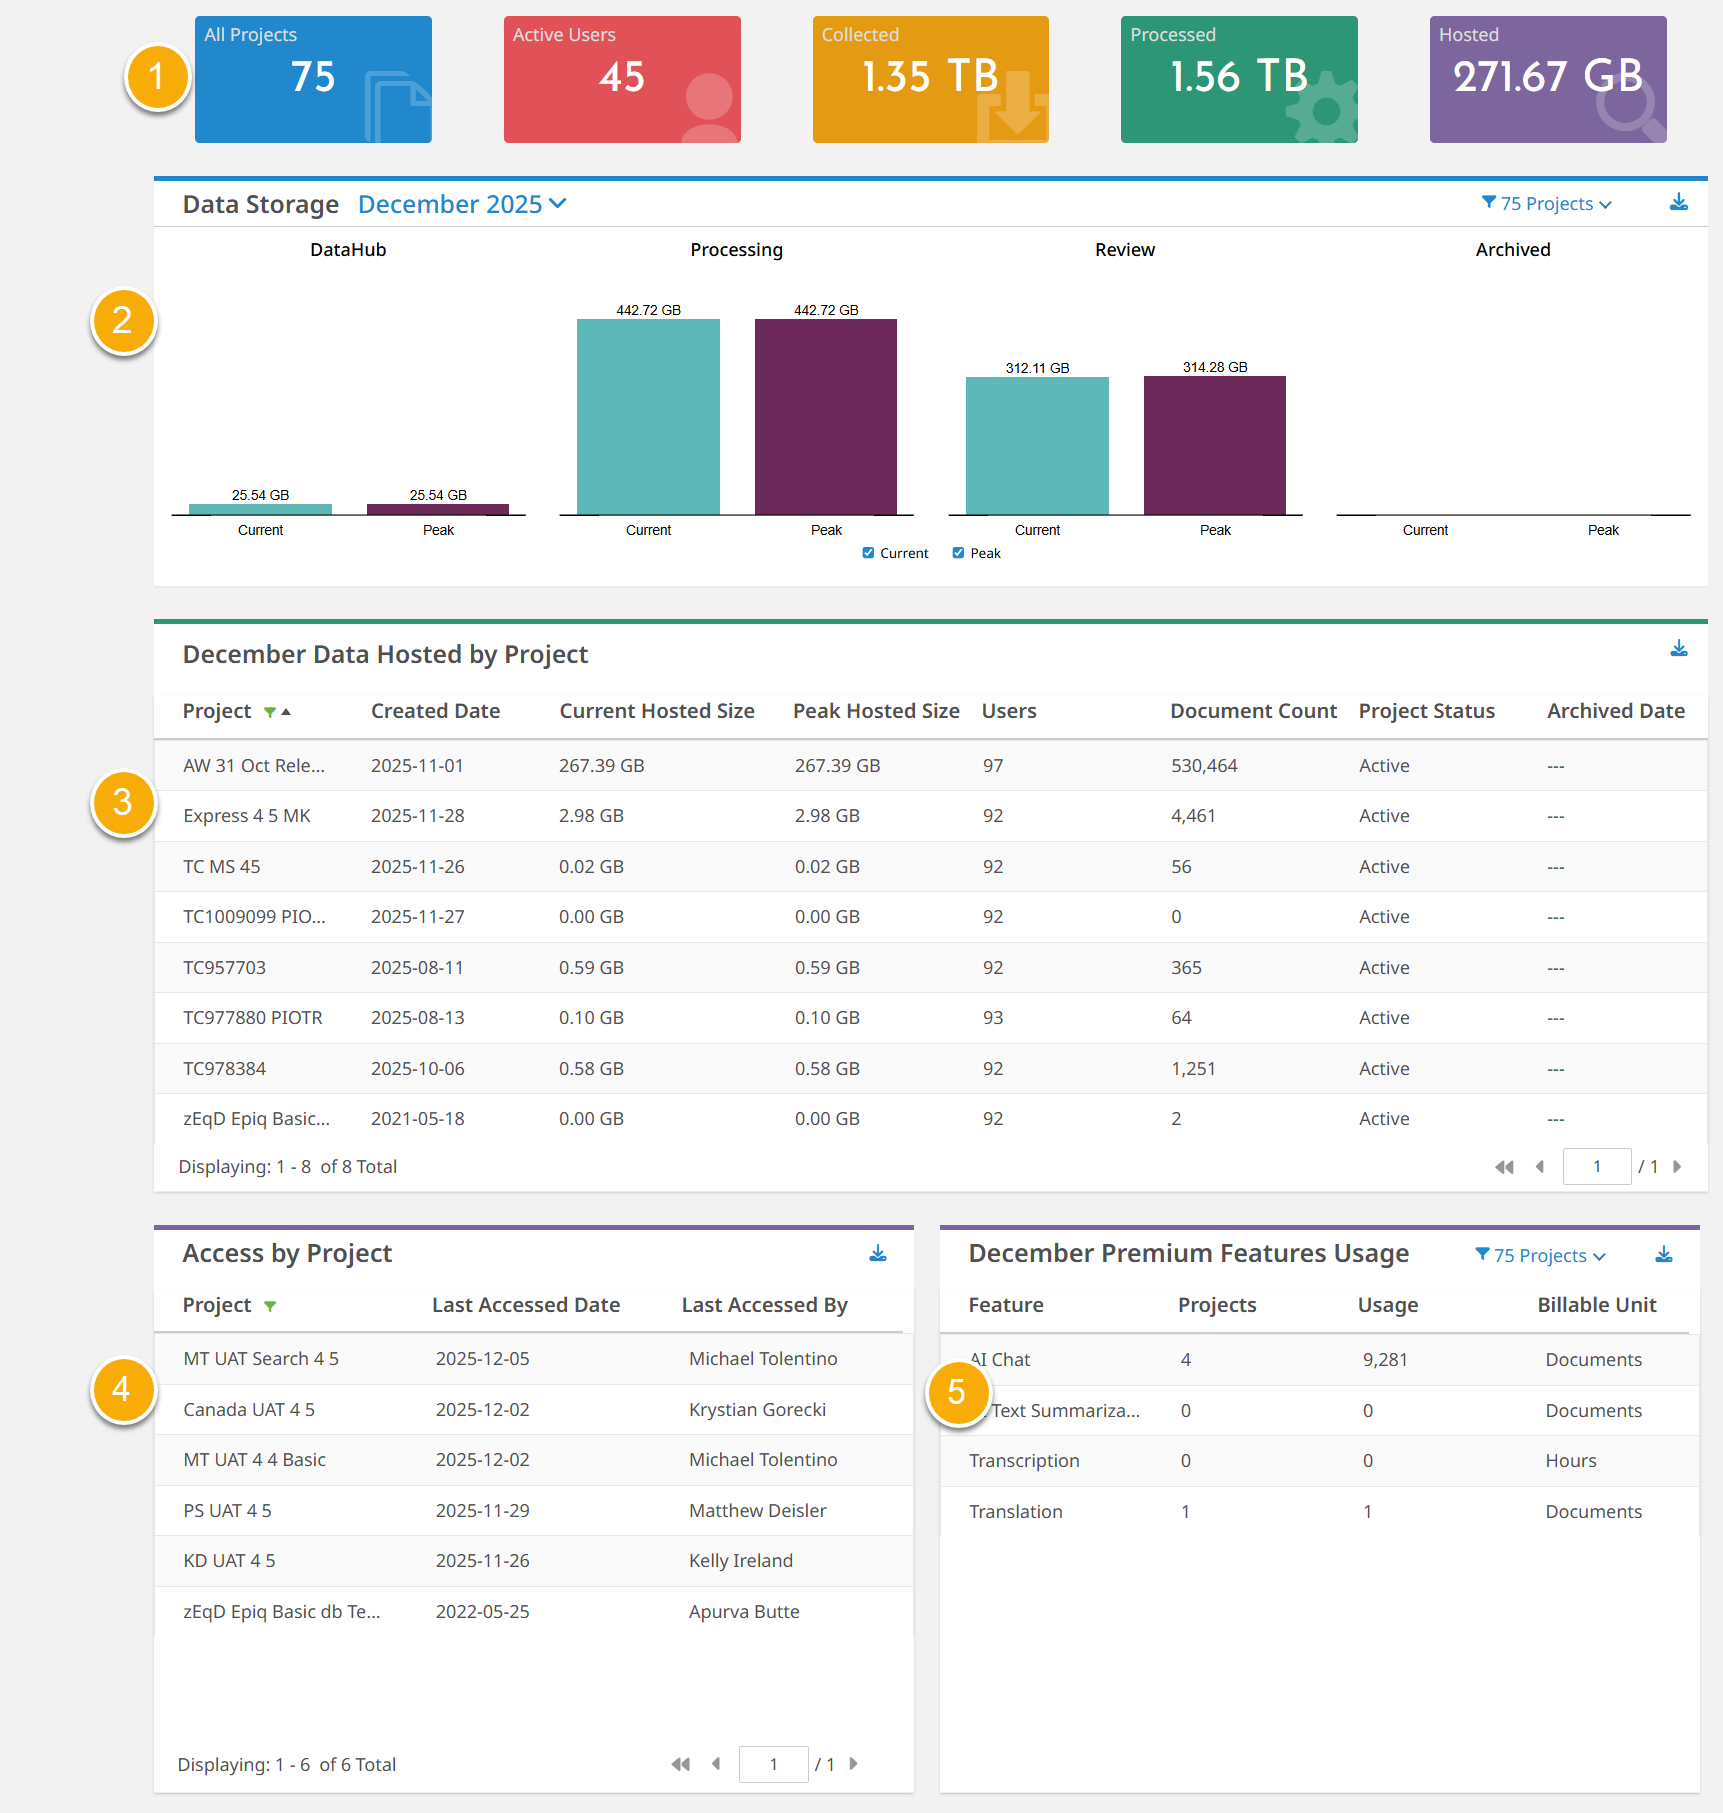
- Summary information at the top of the page includes the following client-specific information.
- . Total number of active projects and archived projects. Deleted projects are not included in this total.
- . Total number of active users with Client Administrator, Project Manager, Litigation Support, Review Manager, Senior Reviewer, and Reviewer roles within the client.
- . Displays the peak storage value from the graph in the current month chart.
- . Displays the peak storage value from the graph in the current month chart.
- . Total amount of the hosted data in the projects.
- <> shows the current and peak hosting size (in GB) for the current month across the following storage categories:
. Amount of hosted data in DataHub.
. Amount of hosted data in projects, excluding the hosted data in Review.
. Amount of hosted data in Review.
. Amount of hosted data in the archived projects.
You can view the data for multiple projects or an individual project. You can select projects from the list at the top right of the chart. You can also choose to view the current data, peak data, or both by selecting or clearing the or options at the bottom of the chart. Hovering over a bar in the chart displays the data size.
The data is the latest or present usage value for a component (for example, DataHub, Processing) at the time of viewing.
The data is the highest recorded usage within the selected month.
For Processing hosting size, since the current value is the sum of processed bytes after each processing job completes, the current and peak values are the same.
You can export this chart data. Refer to Sort, filter, and export Client Dashboard data for more information.
-
shows the hosted data by project. Each row contains the following information for a single project. Projects that contributed hosted storage during the selected billing period may continue to appear in the table with their peak hosted storage values after deletion.
-
. Project name.
- . Creation date for the project.
-
. Current total amount of hosted data per project.
-
. Peak total amount of hosted data per project.
- . Total number of users with access per project.
- . Total number of documents, excluding deleted documents.
- . Current project status: Active, Deleted, or Archived.
- . Archived date for project, if applicable.
You can sort, filter, and export this table information. Refer to Sort, filter, and export Client Dashboard data for more information.
-
-
shows the information about the last accessed date of projects and the user (Client Administrator or user with a lower role) who accessed the project most recently. It lists only active projects and excludes projects that have never been accessed after creation. The table has the following columns.
-
. Displays the project names.
-
. The last accessed time of the project, which can include simply entering the project. By default, the table displays the most recently accessed projects at the top.
-
. The name of the user who accessed the project most recently.
You can sort, filter, and export this table information. Refer to Sort, filter, and export Client Dashboard data for more information.
-
-
shows usage metrics for premium features in active projects. The system adds the current month as a prefix to the table name and refreshes the table data nightly. You can view metrics for multiple projects or an individual project by selecting projects from the project list at the top right of the table.
The table includes the following columns.
-
. Name of the premium feature, such as Transcription and Translation.
-
. Number of projects selected.
-
. Number of billable units. (for example, number of documents for AI Chat).
-
. Measurement unit (for example, Documents for AI Chat, Hours for Transcription).
The following list provides related topics.
-